GBP/USD Bounces Back from Weekly Lows Around 1.2680
The GBP/USD pair showed resilience on Thursday, rebounding from weekly lows of around 1.2680. The Pound Sterling’s recovery against the US Dollar was largely attributed to a decline in US Treasury yields, which weakened the Greenback. By the end of the trading session, the pair was trading at 1.2728, reflecting a gain of 0.20%.
Technical Outlook: Neutral to Upward Bias
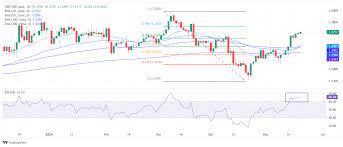
From a technical perspective, the daily chart indicates a neutral to upward bias for the GBP/USD pair. Despite bullish momentum, as evidenced by the Relative Strength Index (RSI), the pair’s inability to surpass the March 21 daily high of 1.2803 has led to a temporary pullback.
Resistance Levels
For a bullish continuation, the GBP/USD must break through the 1.2803 resistance level. Achieving this would pave the way for a rally towards the year-to-date (YTD) high of 1.2893, with the next target being 1.2900. Beyond this, significant resistance looms at the 1.3000 level.
Support Levels
On the downside, if sellers manage to push the pair below the 1.2700 mark, further declines could be in store. The initial support level to watch would be the May 24 low of 1.2674, followed by the 1.2600 psychological mark. Additionally, the 50-day moving average (DMA) at 1.2581 serves as a critical support level.
GBP/USD Price Action: Daily Chart Analysis
The latest price action shows GBP/USD trading at 1.2730, with a daily change of 0.0029 or 0.23%. The pair opened the day at 1.2701, reflecting a steady upward movement throughout the trading session.
Moving Averages
- Daily SMA20: 1.2635
- Daily SMA50: 1.2581
- Daily SMA100: 1.2634
- Daily SMA200: 1.2541
Key Levels
- Previous Daily High: 1.2772
- Previous Daily Low: 1.2699
- Previous Weekly High: 1.2761
- Previous Weekly Low: 1.2676
- Previous Monthly High: 1.2709
- Previous Monthly Low: 1.2300
Fibonacci Retracement Levels
- 38.2%: 1.2727
- 61.8%: 1.2744
Pivot Points
- S1: 1.2676
- S2: 1.2651
- S3: 1.2604
- R1: 1.2749
- R2: 1.2797
- R3: 1.2821
Market Sentiment and Influences
The recent performance of the GBP/USD pair highlights the impact of external economic factors, such as US Treasury yields, on currency movements. The decline in yields has provided some relief to the Pound Sterling, allowing it to recover from its recent lows. However, the broader market sentiment remains cautious, with traders closely monitoring economic data and central bank policies for further clues.
Economic Data and Central Bank Policies
The upcoming economic data releases and central bank meetings will play a crucial role in determining the future direction of the GBP/USD pair. Key data points to watch include inflation figures, employment reports, and GDP growth rates from both the UK and the US. Additionally, any statements or policy changes from the Bank of England (BoE) and the Federal Reserve (Fed) could significantly influence market sentiment.
Conclusion
The GBP/USD pair’s recent rebound from weekly lows around 1.2680 reflects a complex interplay of technical factors and market sentiment. While the technical outlook suggests a neutral to upward bias, the pair faces significant resistance at 1.2803 and beyond. Conversely, critical support levels lie at 1.2674 and the 50-DMA at 1.2581, which could come into play if selling pressure intensifies.
As the market navigates through a landscape of economic uncertainty and fluctuating yields, traders and investors will need to stay vigilant and adapt to the evolving conditions. The GBP/USD pair’s future trajectory will depend on a combination of technical breakouts, economic data, and central bank actions, making it essential to keep a close watch on these factors in the coming weeks.
